S-PLUS allows you to add text to a graph in a few different ways. The
simplest is with the function text. The format is text(x,y,"string")
, and this plots the text string at the coordinates (x
,y).
S-PLUS also has a somewhat more elegant function, legend
. This function takes x and y coordinates, a vector of labels, and a vector
of colors or line types corresponding to those labels.
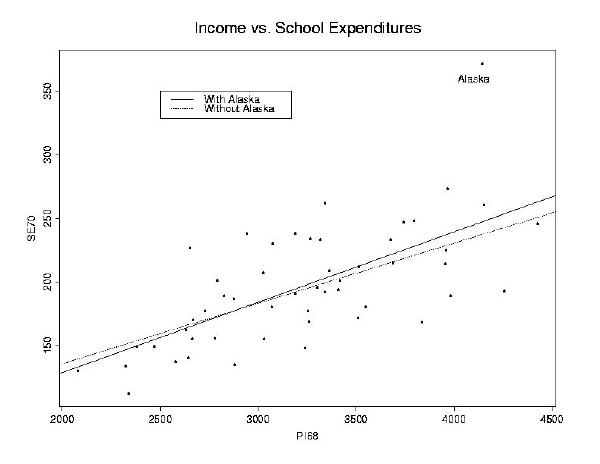
For instance, we could add a legend to the graph which labels the two
line types, and text to write ``Alaska'' approximately underneath
the Alaska data point.
> legend(2500, 350, c("With Alaska","Without Alaska"), lty=c(1,2))
> text(4100, 360, "Alaska")