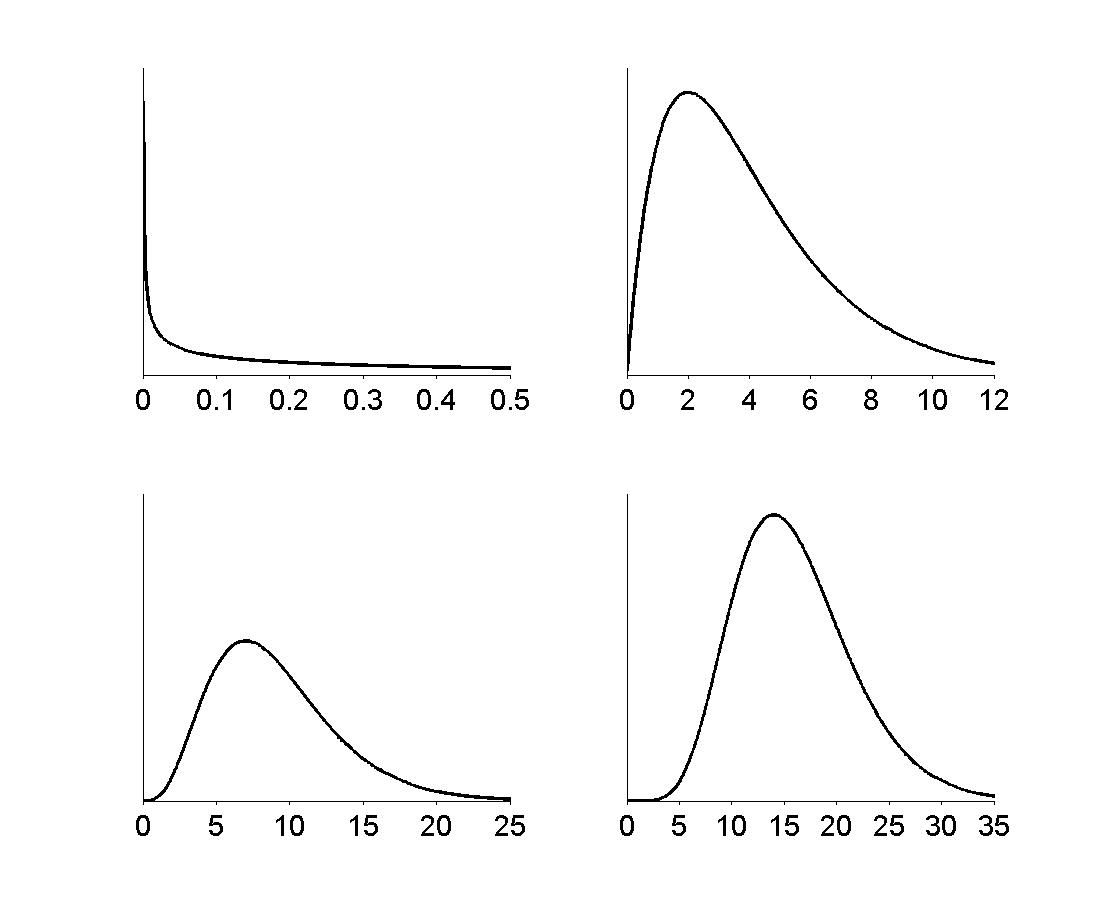
%  This script plots four chi-squared densities, with 1, 4, 9, and 16
%   degrees of freedom, respectively.

%  We first set up the varying elements (the distribution
%  parameters, and the limits and tick-marks on the x-axes), and
%  then loop through to plot each subplot with the same style.

degreesOfFreedomList = [1, 4, 9, 16];
xMaxes = [0.5, 12, 25, 35];
xTickMarks = [0.1, 2, 5, 5];
resolution = 1000;

for i = 1:4

    subplot(2, 2, i)

    xMax = xMaxes[i];
    xTickMark = xTickMarks[i];
    degreesOfFreedom = degreesOfFreedomList[i];

    xValues = 0 : (xMax / resolution) : xMax;
    chiSquaredPdfValues = chi2pdf(xValues, degreesOfFreedom);

    plot(xValues, chiSquaredPdfValues, '-k', 'LineWidth', 2)
    set(gca, 'Box', 'off', 'FontSize', 18, ...
             'XLim', [0, xMax], ...
             'XTick', 0: xTickMark : xMax, ...
             'YTick', [], 'TickDir', 'out')

end


set(gcf, 'Position', [200, 100, 1100, 900])