% This script plots a binomial likelihood function as a function of
% x, and as a function of theta for fixed x.
%
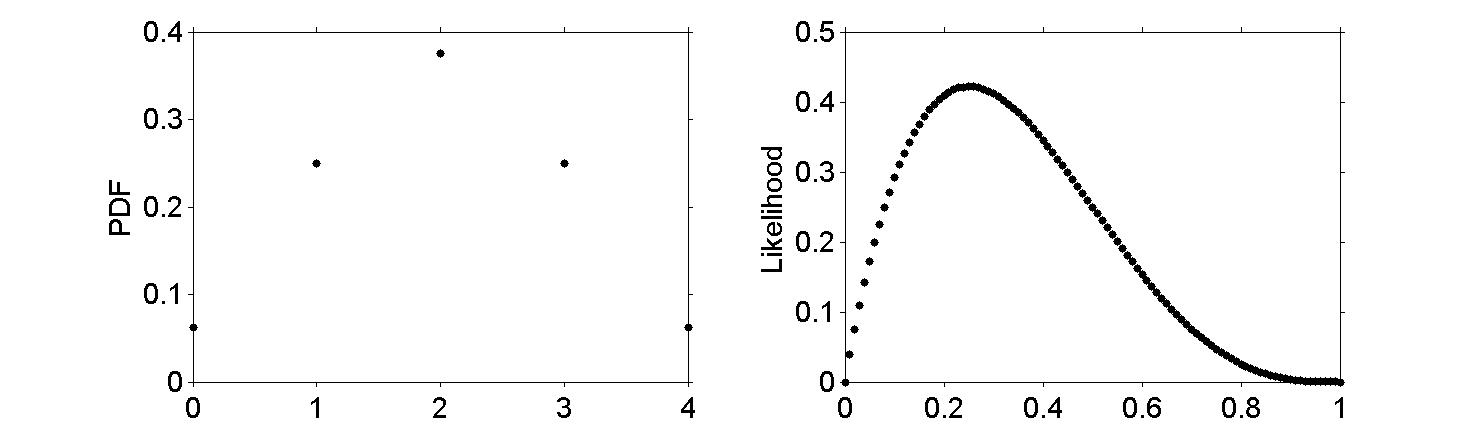
% Figure caption: Comparison of pdf of f(x|theta) when viewed as
% a function of x with theta fixed at 0.5 (on left) or of theta
% with x fixed at x = 1 (on right). On the right hand side, the
% pdf is evaluated for 99 equally spaced values of theta from 0.01
% to 0.99.
figure
set(gcf, 'Position', [0, 200, 1900 500])
% Plot the density evaluated for several possible x values.
subplot(1, 2, 1)
xvals = 0:1:4;
plot(xvals, binopdf(xvals, 4, 0.5), '.k', 'MarkerSize', 18)
set(gca, 'XTick', 0:1:4, 'YTick', 0:0.1:0.4, ...
'TickDir', 'out', 'FontSize', 18)
ylabel('PDF', 'FontSize', 18)
title('')
% Plot the density as a function of theta.
subplot(1, 2, 2)
thetavals = 0:0.01:1;
plot(thetavals, binopdf(1, 4, thetavals), '.k', 'MarkerSize', 18)
set(gca, 'XTick', 0:0.2:1, 'YTick', 0:0.1:0.5, ...
'TickDir', 'out', 'FontSize', 18)
ylabel('Likelihood', 'FontSize', 18)
title('')