% This script produces figure 14.4 in Analysis of Neural Data,
% an analysis of spike data from a rat Hippocampus.
%
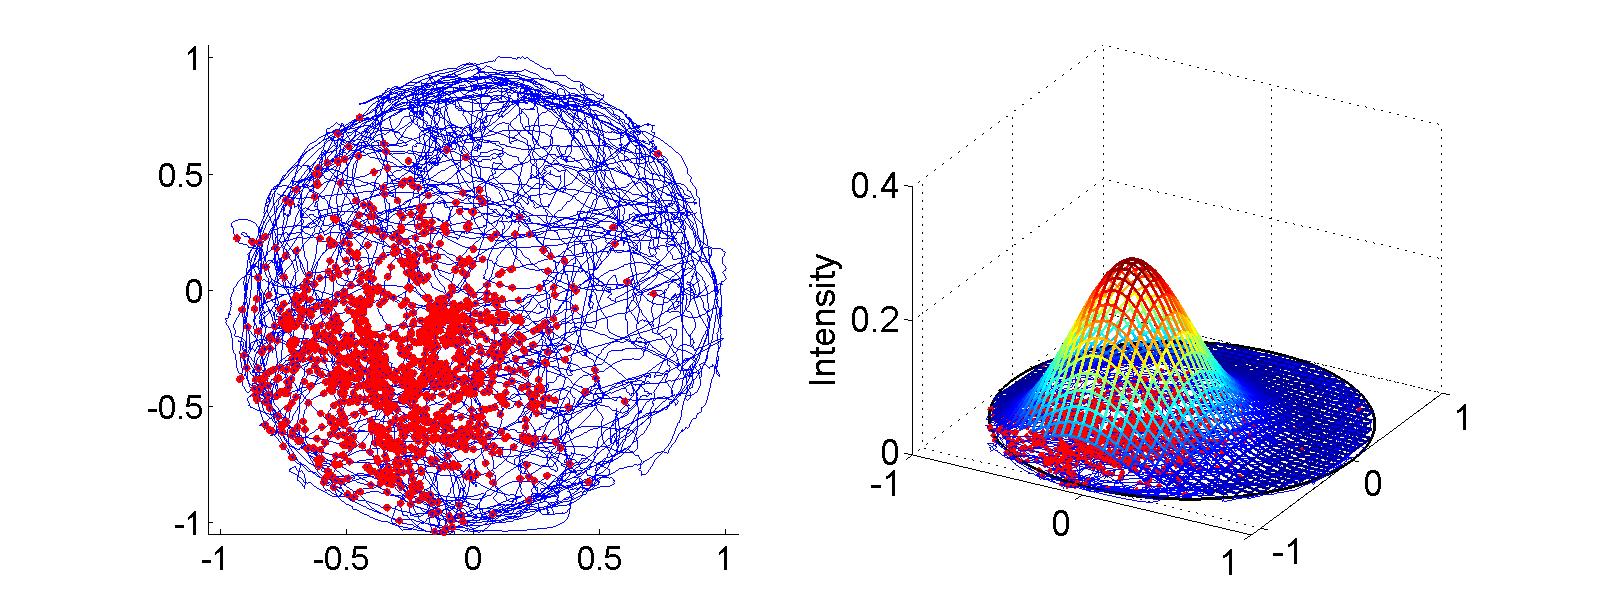
% Figure caption: Spiking activity of a rat Hippocampal place cell
% during a free-foraging task in a circular environment. Left:
% Visualization of animals path and locations of spikes. Right:
% Place field model for this neuron, with parameters fit by the
% method of maximum likelihood.
load('hipp_data.mat')
% hipp_data.mat contains:
% xN - x position of rat
% yN - y position of rat
% spikes - whether or not the neuron spiked
spiked = spikes2 == 1;
% Fit a generalized linear model for spikes on quadratic terms of
% location, with poisson likelihood.
nObservations = numel(spikes);
covariates = [xN, yN, xN.^2, yN.^2, xN.*yN];
beta = glmfit([xN, yN, xN.^2, yN.^2, xN.*yN], spikes, 'poisson');
% Estimate lambda where all observations are.
lambdaEstimates = exp( [ones(nObservations), coefficients] * beta );
% Create new x and y values to plot a smoother estimate of lambda.
x_new = meshgrid(-1:0.05:1);
y_new = flipud(x_new');
nPlotted = numel(x_new)
newCovariates = [x_new, y_new, x_new.^2, y_new.^2, x_new .* y_new ];
lambdaForPlot = exp( [ones(nPlotted), newCovariates] * beta );
% Don't plot anything outside the environment.
lambdaForPlot(x_new.^2 + y_new.^2>1) = NaN;
%%%%%%%%%% First plot is the rat's path + dots at actual spikes %%%%%%%%%%
subplot(1, 2, 1)
% Plot the rat's path.
plot(xN, yN, '-b')
hold on;
% Add dots where spikes occured.
plot(xN(spiked, 1), yN(spiked, 1), 'or', ...
'MarkerSize', 4, 'MarkerFaceColor', 'r')
% Clean up axes.
set(gca, 'FontSize', 20, 'Box', 'off', ...
'XLim', [-1.05, 1.05], 'YLim', [-1.05, 1.05], ...
'XTick', -1:0.5:1, 'YTick', -1:0.5:1)
%%%%%%%%%% Second plot shows our estimate of lambda as a surface %%%%%%%%
subplot(1, 2, 2)
h_mesh = mesh(x_new, y_new, lambdaForPlot, 'LineWidth', 2);
hold on;
alpha(0)
% Add grid on floor.
theta = -pi:0.01:pi;
plot3(cos(theta), sin(theta), zeros(size(theta)), 'k', ...
'LineWidth', 2);
% Add rat's path and dots for spikes again.
plot(xN, yN, '-b')
plot(xN(spiked, 1), yN(spiked, 1), 'or', ...
'MarkerSize', 3, 'MarkerFaceColor', 'r')
% Clean up axes.
set(gca, 'FontSize', 22, ...
'XLim', [-1, 1], 'YLim', [-1.1, 1], ...
'XTick', -1:1:1, 'YTick', -1:1:1, 'ZTick', 0:0.2:0.4)
zlabel('Intensity', 'FontSize', 22)
set(gcf, 'Position', [200, 200, 1600, 600])
% Set camera position.
campos([7, -13.0903, 1.9321])