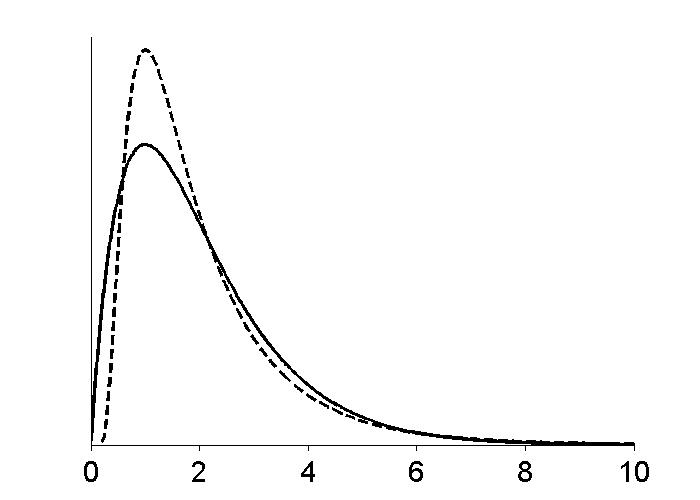
%  This script produces a figure of the PDF of an inverse gaussian along
%  with that of a gamma distribution.  The distributions are made to have
%  the same mean and variance.

%  Produce a sequence of values at which to compute the densities.
xdens = 0:0.01:10;

%  Compute both pdfs.  The 2,1 and 2,4 are distribution parameters.
ydens1 = gampdf(xdens, 2, 1);
ydens2 = pdf('inversegaussian', xdens, 2, 4);

%  Plot both pdfs.  The '-k' and '--k' distinguish the line types.
plot(xdens, ydens1, '-k', 'LineWidth', 2)
hold on;
plot(xdens, ydens2, '--k', 'LineWidth', 2)

%  Set graphical parameters.
set(gca, 'Box', 'off', ...          %  Don't box the figure.
        'FontSize', 18, ...         %  Specify the fontsize for ticks.
        'XTick', 0:2:10, ...        %  Choose location of X ticks.
        'YTick', [], ...            %  Do not use Y ticks.
        'TickDir', 'out')           %  Have the tickmarks face out.
%   Sets the position of the figure at 200 from the left, and 100 from the
%   top, with a width of 500 and a height of 400.
set(gcf, 'Position', [200, 100, 700, 500])