%Figures produced by Whittle likelihood smoothing will appear differently
%from the analogous R versions (using simple Gaussian smoothers on the
%periogograms); often much more smoothed
lfp = load('lfp-ryan.dat');
time = 1:1000;
lfp1 = lfp(1:1000);
lfp30 = lfp(29001:30000);
f = (0:500)./1000;
knots = [1, 200:200:1000];
splinefit1 = spline(knots, lfp1(knots), time);
splinefit30 = spline(knots, lfp30(knots), time);
lfp1detrend = lfp1-splinefit1';
lfp30detrend = lfp30-splinefit30';
I1detrend = periodogram(lfp1detrend)';
I30detrend = periodogram(lfp30detrend)';
%Example of smoothing the Whittle Likelihood
%
%sknot = [0, 10, 20, 30, 40, 50];
%sb = spline(sknot, eye(size(sknot, 2)), 1:50);
%[b1, dev1, stats1] = glmfit(sb', I1detrend(1:50), 'gamma');
%[b30, dev30, stats30] = glmfit(sb', I30detrend(1:50), 'gamma');
%smoothI1 = glmval(b1, sb', 'reciprocal');
%smoothI30 = glmval(b30, sb', 'reciprocal');
maxt1 = size(I1detrend, 2);
maxt30 = size(I30detrend, 2);
smoothI1 = zeros(1, maxt1);
smoothI30 = zeros(1, maxt30);
bw = 1;
for i = 1:maxt1
I1ker = normpdf((i-(1:maxt1))/bw);
smoothI1(i) = sum(I1ker.*I1detrend)/sum(I1ker);
end
for i = 1:maxt30
I30ker = normpdf((i-(1:maxt30))/bw);
smoothI30(i) = sum(I30ker.*I30detrend)/sum(I30ker);
end
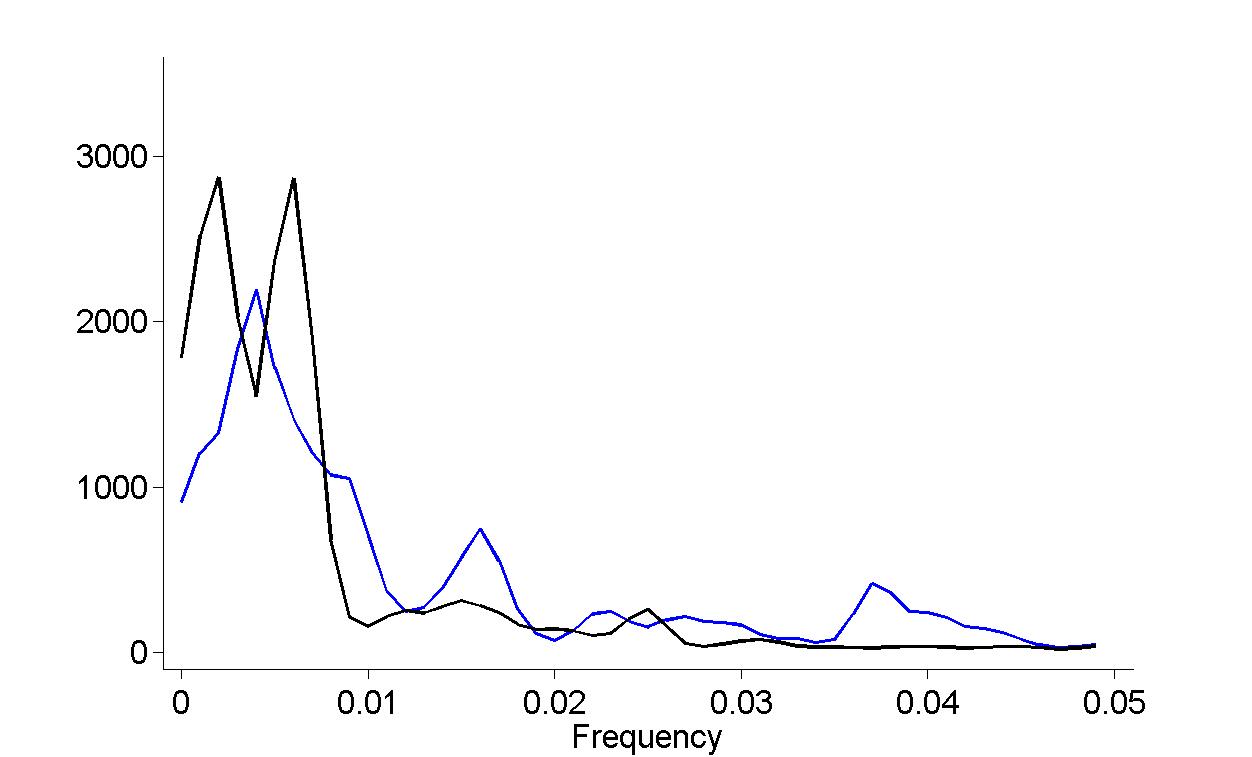
plot(f(1:50), smoothI1(1:50), '-b', 'LineWidth', 2)
hold on;
plot(f(1:50), smoothI30(1:50), '-k', 'LineWidth', 2)
set(gca, 'Box', 'off', 'FontSize', 20, ...
'XLim', [-0.001, 0.051], 'YLim', [-100, 3600], ...
'XTick', 0:0.01:0.05, 'YTick', 0:1000:3000, ...
'TickDir', 'out')
xlabel('Frequency', 'FontSize', 20)
set(gcf, 'Position', [200, 100, 1400, 800])