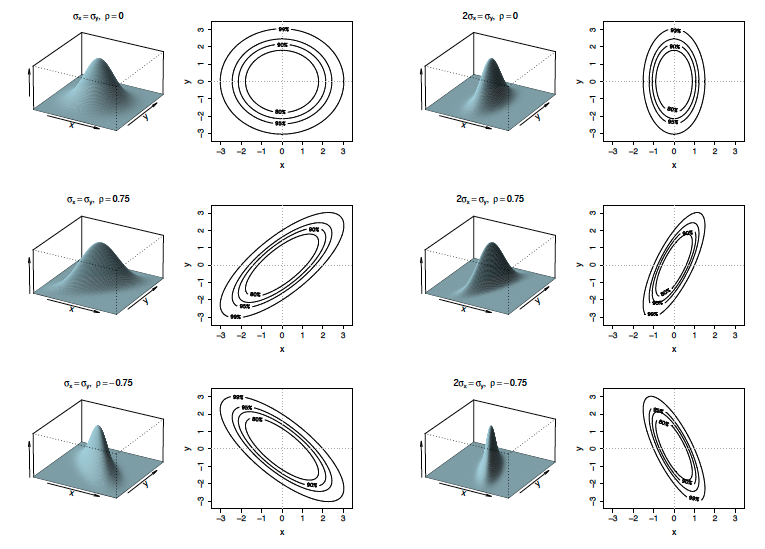
%   This script creates a figure with six (really 12) subplots: pairs of
%   graphs showing the 2d multivariate gaussian pdf.  In each pair, the
%   first shows the pdf as the height of a 2d surface, and the second shows
%   confidence intervals for points at several levels.

%   The parameter matrix contains data for six gaussian distributions.
%   Each row corresponds to a distribution, with the mean specified by the
%   first two entries, and the covariance matrix by the last three.
%
%   The functions create_contour and create_density are in the
%   files create_contour.m and create_density.m
param_mat = [0, 0, 1,   1, 0;
             0, 0, 0.5, 1, 0;
             0, 0, 1,   1, 0.75;
             0, 0, 0.5, 1, 0.75;
             0, 0, 1,   1, -0.75;
             0, 0, 0.5, 1, -0.75];

%  This loops through the six distributions and creates each pair of subplots.
for i = 1:6
    figure
    subplot(1, 2, 1)
    create_density([param_mat(i, 1), param_mat(i, 2)], ...
                    param_mat(i, 3), ...
                    param_mat(i, 4), ...
                    param_mat(i, 5))
    freezeColors
    subplot(1, 2, 2)
    create_contour([param_mat(i, 1), param_mat(i, 2)], ...
                    param_mat(i, 3), ...
                    param_mat(i, 4), ...
                    param_mat(i, 5))

    %  This controls the position of the subplot.
    leftStart = 200 + 20*i;
    topStart = 200 + 20*i;
    width = 1200;
    height = 400;
    set(gcf, 'Position', ...
        [leftStart, topStart, leftStart + width, topStart + height])
end