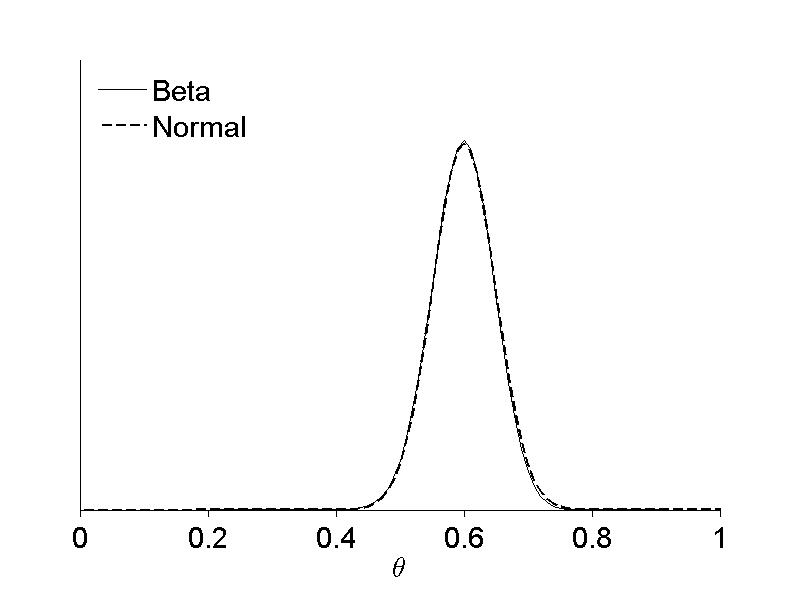
%  This script shows a very close Normal approximation for a Beta
%  distribution.  The beta is Beta(61,41) and the normal is
%  N(0.6, (0.49)^2)
%

figure
set(gcf, 'Position', [200, 100, 800, 600])
set(gca, 'Units', 'normalized', 'Position', [0.1 0.15 0.8 0.75])


xValues = 0:0.01:1;

%  Plot the beta density.
plot(xValues, betapdf(xValues, 61, 41), '-k', 'LineWidth', 1.2)

hold on;
% ... and the normal.
plot(xValues, normpdf(xValues, 0.6, 0.049), '--k', 'LineWidth', 1.5)


set(gca, 'FontSize', 18, 'Box', 'off', 'TickDir', 'out', ...
         'XLim', [0, 1], 'XTick', 0:0.2:1, 'YTick', [])
xlabel('$$\theta$$', 'Interpreter', 'LaTex', 'FontSize', 18)

graphLegend = legend('Beta', 'Normal', 'Location', 'NorthWest');
set(graphLegend, 'box', 'off')