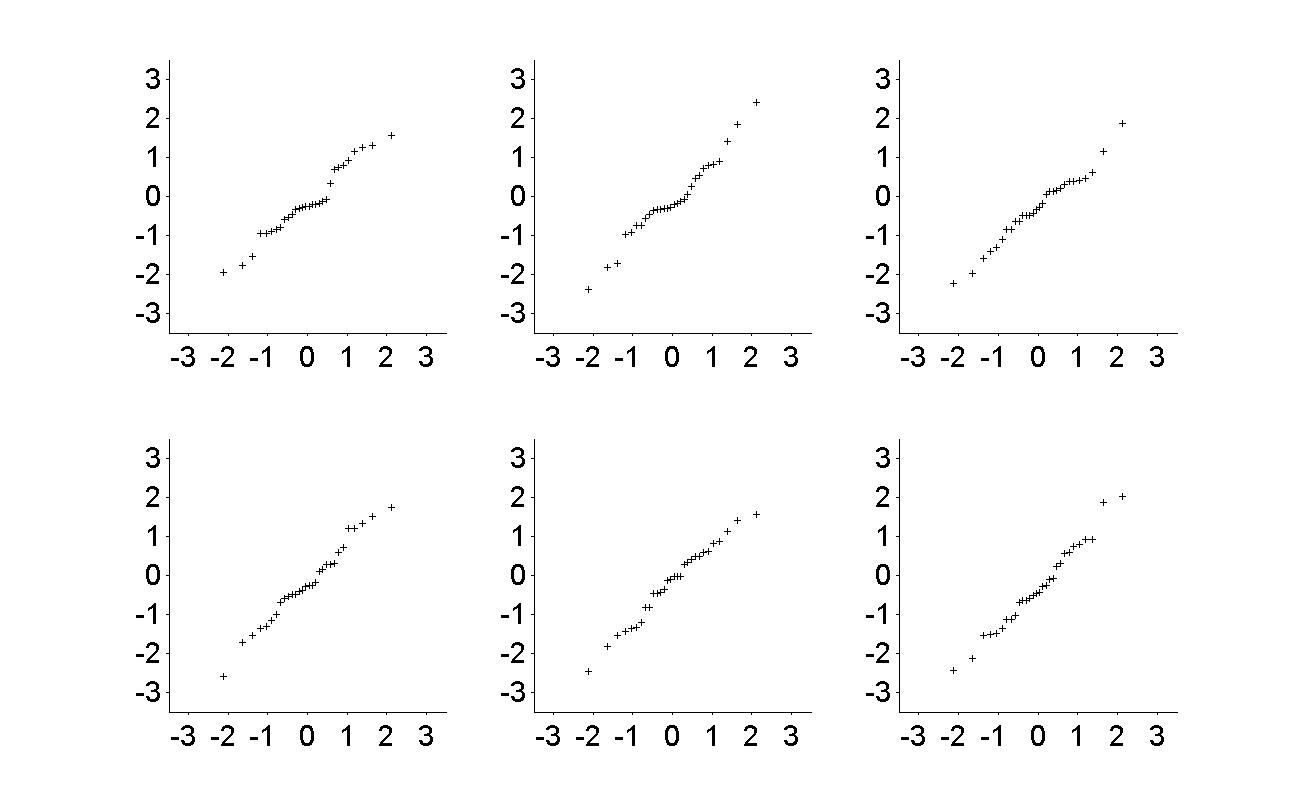
%  This script plots six QQ-normal plots for samples of a standard
%  normal.  Each plot should show small deviations from normality.


% Set up parameters and the distribution object.
standardNormal = ProbDistUnivParam('normal', [0, 1]);
N = 30;

%  Set up figure object.
figure
set(gcf, 'Position', [200, 100, 1300, 800])
axLimits = [-3.5, 3.5];
axTicks  = -3:1:3;


for i = 1:6
    normSample = normrnd(0, 1, N, 1);
    subplot(2, 3, i)
    qq = qqplot(normSample, standardNormal);
    set(qq, 'Color', 'w', 'MarkerSize', 4, 'MarkerEdgeColor', 'k')
    set(gca, 'xlim', axLimits, 'ylim', axLimits, ...
             'XTick', axTicks, 'YTick', axTicks, ...
             'FontSize', 18, 'TickDir', 'out')
    xlabel('')
    ylabel('')
    title('')
end