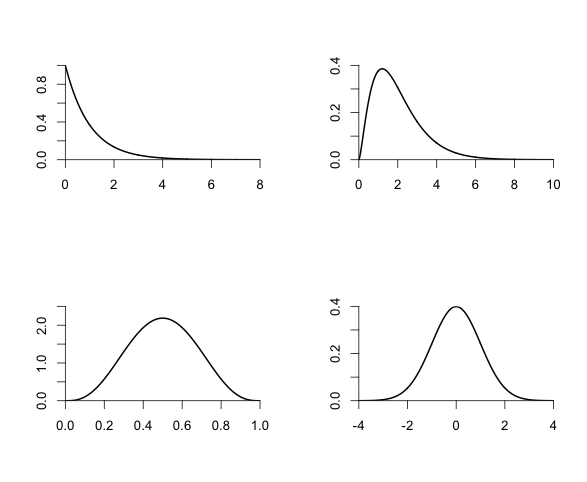
#  Produces four plots of different density functions in a 2x2 window.
#  The exponential, gamma, beta, and normal densities are shown.


#  Set up a 2x2 plot.
par(mfrow = c(2, 2))

#  Setting the parameters 'xaxs' and 'yaxs' to 'i' (for "internal") lets us
#  specify the plot windows exactly.  By default, plot windows are enlarged
#  by about 6%.  Using the "internal" setting prevents this enlargement.
par(xaxs = "i", yaxs = "i")

#  Set some other style parameters.
line.width = 2
label.size = 1.3

#  Plot the exponential density.
x <- seq(from = 0, to = 8, by = 0.01)
exponential.pdf <- dexp(x)
plot(x, exponential.pdf,
     ylim = c(0, 1),
     type = "l", lwd = line.width,
     main = "", xlab = "", ylab = "",
     bty = "n", cex.lab = label.size)

#  Plot the Gamma density.
x <- seq(from = 0, to = 10, by = 0.01)
gamma.pdf <- dgamma(x, 2.5, 1.25)
plot(x, gamma.pdf,
     ylim = c(0, 0.4),
     type = "l", lwd = line.width,
     main = "", xlab = "", ylab = "",
     bty = "n", cex.lab = label.size)

# Plot the Beta density.
x <- seq(from = 0, to = 1, by = 0.01)
beta.pdf = dbeta(x, 4, 4)
plot(x, beta.pdf,
  ylim = c(0, 2.5), type = "l", lwd = line.width,
  main = "", xlab = "", ylab = "",
  bty = "n", cex.lab = label.size)

# Plot the Normal density.
x <- seq(from = -4, to = 4, by = 0.01)
normal.pdf <- dnorm(x)
plot(x, normal.pdf,
    ylim = c(0, 0.4), type = "l", lwd = 2,
    main = "", xlab = "", ylab = "",
    bty = "n", cex.lab = 1.3)

#  Print the image to a ps.
dev.print(device = postscript, "3.3.eps", horizontal = TRUE)