# This script fits a 20th order polynomial to noisy observations of
# f(x) = sin(x) + 2*exp( - 30 * x^2)
#
#
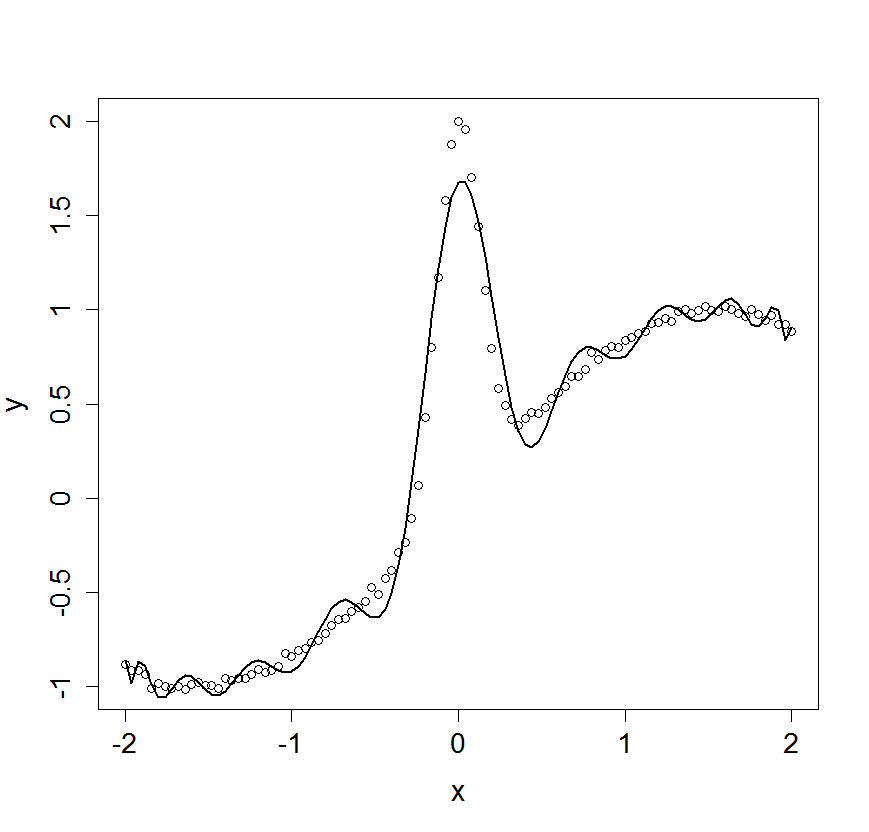
# Figure caption: Data simulated from function f(x) = sin(x) +
# 2exp(-30*x*x) together with twentieth order polynomial fit
# (shown as line). Note that the polynomial is over-fitting
# (under-smoothing) in the relatively smooth regions of f(x), and
# under-fitting (over-smoothing) in the peak. (In the data shown
# here, the noise standard deviation is 1/50 times the standard
# deviation of the function values.)
n.observations <- 101
polynomial.order <- 20
# Set up observations and function values.
x.at.obs <-seq(from = -2, to = 2, length.out = n.observations)
f.at.obs <- sin(x.at.obs) + 2*exp(-30 * (x.at.obs^2))
# Obtain a reasonable noise level and add noise.
f.sd <- sd(f.at.obs)
relative.noise <- 1/50
added.noise.sd <- f.sd * relative.noise
added.noise <- rnorm(n.observations, 0, added.noise.sd)
observations <- f.at.obs + added.noise
# Obtain all polynomials.
m.polynomials <- matrix(0, n.observations, polynomial.order)
for(i in 1:polynomial.order){
m.polynomials[,i] <- x.at.obs^i
}
polynomial.model <- lm(observations ~ m.polynomials)
polynomial.predictions <- fitted(polynomial.model)
plot(x.at.obs, observations,
xlim = c(-2, 2), ylim = c(-1, 2), xaxt = "n", yaxt = "n",
main = "", xlab = "x", ylab = "y", cex.lab = 1.5)
lines(x.at.obs, polynomial.predictions, col = 153, lwd = 2)
points(x.at.obs, observations)
# Clean up axes.
axis.size <- 1.4
x.axis <- seq(from = -2, to = 2, by = 1)
y.axis <- seq(from = -1, to = 2, by = 0.5)
axis(1, at = x.axis, labels = x.axis, cex.axis = axis.size)
axis(2, at = y.axis, labels = y.axis, cex.axis = axis.size)
# Close the graphics device.
dev.print(device = postscript, "15.2.added.noise", horizontal = TRUE)