Consider the following  contingency
table where the classification variables are
contingency
table where the classification variables are
IF we consider only models that can be written like factorial models
(e.g.,  ) and include all
main effects, there are still 113 possible models. Even if all these
models had closed form estimates (which they don't) looking at all the
models would be difficult. As always, our prefer to have a
reasonable (fitting) model with a small number of parameters over a
similar model with more parameters.
) and include all
main effects, there are still 113 possible models. Even if all these
models had closed form estimates (which they don't) looking at all the
models would be difficult. As always, our prefer to have a
reasonable (fitting) model with a small number of parameters over a
similar model with more parameters.
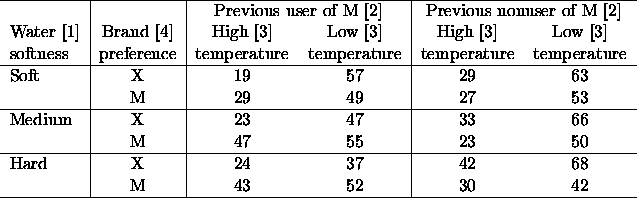
Fienberg's book (1987) gives the following scenario for constructing a model for these data. (This ignores the graphical model stuff we have just been talking about. I will try to do a graphical model in a moment.)


 , and
, and 
Lets start by getting in the data, and looking at it.
402 > ries <- fac.design(c(2,2,2,3),list(Temp=c("H","L"),
+ Pre=c("M","X"),Brand=c("X","M"), Soft=c("Soft","Med","Hard")))
402 > ries$Resp <- scan("ries-smith.dat")
402 > ries
   Temp Pre Brand Soft Resp
 1    H   M     X Soft   19
 2    L   M     X Soft   57
 3    H   X     X Soft   29
 4    L   X     X Soft   63
 5    H   M     M Soft   29
 6    L   M     M Soft   49
 7    H   X     M Soft   27
 8    L   X     M Soft   53
 9    H   M     X  Med   23
10    L   M     X  Med   47
11    H   X     X  Med   33
12    L   X     X  Med   66
13    H   M     M  Med   47
14    L   M     M  Med   55
15    H   X     M  Med   23
16    L   X     M  Med   50
17    H   M     X Hard   24
18    L   M     X Hard   37
19    H   X     X Hard   42
20    L   X     X Hard   68
21    H   M     M Hard   43
22    L   M     M Hard   52
23    H   X     M Hard   30
24    L   X     M Hard   42
Start by fitting the simplest model in the list above,
402 > glm(Resp ~ Temp+Pre+Brand+Soft, family=poisson, data=ries)
Call:
glm(formula = Resp ~ Temp + Pre + Brand + Soft, family = poisson, data = ries)

Coefficients:
 (Intercept)      Temp       Pre       Brand      Soft1       Soft2
    3.699209 0.2745538 0.0436785 -0.00793668 0.02687216 0.003092153

Degrees of Freedom: 24 Total; 18 Residual
Residual Deviance: 42.92866
Here is a list of the other models suggested above
[24][1][3]
glm(formula = Resp ~ Temp + Brand * Pre + Soft, family = poisson,
        data= ries)
Degrees of Freedom: 24 Total; 17 Residual
Residual Deviance: 22.34719

[24][34][1]
glm(formula = Resp ~ Soft + Pre * Brand + Temp * Brand, family = poisson,
         data = ries)
Degrees of Freedom: 24 Total; 16 Residual
Residual Deviance: 17.98559

[13][24][34]
glm(formula = Resp ~ Soft * Temp + Pre * Brand + Temp * Brand, family
        = poisson, data = ries)
Degrees of Freedom: 24 Total; 14 Residual
Residual Deviance: 11.88649

[13][234]
glm(formula = Resp ~ Soft * Temp + Pre * Brand * Temp, family = poisson,
      data = ries)
Degrees of Freedom: 24 Total; 12 Residual
Residual Deviance: 8.406872

[123][234]
glm(formula = Resp ~ Pre * Soft * Temp + Pre * Brand * Temp,
        family = poisson, data = ries)
Degrees of Freedom: 24 Total; 8 Residual
Residual Deviance: 5.656044
In this case, note that the models are all nested: [123][234] > [13][234] > [13][24][34] > [1][24][34] > [1][24][3]. What was the good model?
In many respects this type of ``guided'' model selection is very satisfying. But, as with regression a more formal stepwise procedure is often helpful. Splus provides all the usual tools, so lets just let it go.
402 > step(mymod,scope=list(upper=~.^4,lower=~.^1))
Start:  AIC= 54.9287
 Resp ~ Pre + Soft + Temp + Brand

Single term additions

Model:
Resp ~ Pre + Soft + Temp + Brand

scale:  1

           Df Sum of Sq      RSS       Cp
    <none>              43.87621 55.87621
  Pre:Soft  2   1.07484 42.80136 58.80136
  Pre:Temp  1   1.25286 42.62335 56.62335
 Pre:Brand  1  20.50510 23.37111 37.37111
 Soft:Temp  2   6.07932 37.79688 53.79688
Soft:Brand  2   0.39516 43.48104 59.48104
Temp:Brand  1   4.35622 39.51998 53.51998

Step:  AIC= 36.3472
 Resp ~ Pre + Soft + Temp + Brand + Pre:Brand

Single term deletions

Model:
Resp ~ Pre + Soft + Temp + Brand + Pre:Brand

scale:  1

          Df Sum of Sq      RSS       Cp
   <none>              23.12993 37.12993
Pre:Brand  1  20.37267 43.50260 55.50260
Single term additions

Model:
Resp ~ Pre + Soft + Temp + Brand + Pre:Brand

scale:  1

           Df Sum of Sq      RSS       Cp
    <none>              23.12993 37.12993
  Pre:Soft  2  1.075196 22.05473 40.05473
  Pre:Temp  1  1.253319 21.87661 37.87661
 Soft:Temp  2  6.081331 17.04860 35.04860
Soft:Brand  2  0.395230 22.73470 40.73470
Temp:Brand  1  4.357797 18.77213 34.77213

Step:  AIC= 33.9856
 Resp ~ Pre + Soft + Temp + Brand + Pre:Brand + Temp:Brand

Single term deletions

Model:
Resp ~ Pre + Soft + Temp + Brand + Pre:Brand + Temp:Brand

scale:  1

           Df Sum of Sq      RSS       Cp
    <none>              18.33277 34.33277
 Pre:Brand  1  20.37196 38.70473 52.70473
Temp:Brand  1   4.35039 22.68316 36.68316
Single term additions

Model:
Resp ~ Pre + Soft + Temp + Brand + Pre:Brand + Temp:Brand

scale:  1

           Df Sum of Sq      RSS       Cp
    <none>              18.33277 34.33277
  Pre:Soft  2  1.075230 17.25754 37.25754
  Pre:Temp  1  0.691974 17.64079 35.64079
 Soft:Temp  2  6.081616 12.25115 32.25115
Soft:Brand  2  0.395246 17.93752 37.93752

Step:  AIC= 31.8865
 Resp ~ Pre + Soft + Temp + Brand + Pre:Brand + Temp:Brand + Soft:Temp

Single term deletions

Model:
Resp ~ Pre + Soft + Temp + Brand + Pre:Brand + Temp:Brand + Soft:Temp

scale:  1

           Df Sum of Sq      RSS       Cp
    <none>              11.91664 31.91664
 Pre:Brand  1  20.37144 32.28808 50.28808
Temp:Brand  1   4.35029 16.26693 34.26693
 Soft:Temp  2   6.05905 17.97569 33.97569
Single term additions

Model:
Resp ~ Pre + Soft + Temp + Brand + Pre:Brand + Temp:Brand + Soft:Temp

scale:  1

           Df Sum of Sq      RSS       Cp
    <none>              11.91664 31.91664
  Pre:Soft  2  1.088615 10.82802 34.82802
  Pre:Temp  1  0.691996 11.22464 33.22464
Soft:Brand  2  0.343602 11.57304 35.57304
Call:
glm(formula = Resp ~ Pre + Soft + Temp + Brand + Pre:Brand + Temp:Brand + Soft:
        Temp, family = poisson, data = ries)

Coefficients:
 (Intercept)        Pre      Soft1      Soft2      Temp      Brand  Pre:Brand
    3.682699 0.04343019 0.04342718 0.01564269 0.2782644 0.01658998 -0.1437655
  Temp:Brand   Soft1Temp   Soft2Temp
 -0.06836051 -0.05251834 -0.04906982

Degrees of Freedom: 24 Total; 14 Residual
Residual Deviance: 11.88649
We end up with a model that is at least familiar looking.
We could also proceed by looking at parameter values, again as we did in regression, but it is a little tricky.
402 >  mymod <- glm(Resp ~ Soft*Pre*Temp*Brand, family=poisson, data=ries)
402 > summary(mymod)

Call: glm(formula = Resp ~ Soft * Pre * Temp * Brand, family = poisson, data = ries)

Coefficients:
                         Value Std. Error       t value
      (Intercept)  3.674892823 0.03362662  109.28523105
            Soft1  0.034602276 0.04166801    0.83042779
            Soft2  0.012394833 0.02349486    0.52755510
              Pre  0.042297443 0.03362662    1.25785595
             Temp  0.285673485 0.03362662    8.49545670
            Brand  0.015236657 0.03362662    0.45311295
         Soft1Pre -0.039962253 0.04166801   -0.95906306
         Soft2Pre  0.016015575 0.02349486    0.68166297
        Soft1Temp -0.045744735 0.04166801   -1.09783816
        Soft2Temp -0.052760617 0.02349486   -2.24562393
         Pre:Temp  0.025849868 0.03362662    0.76873229
       Soft1Brand  0.012866861 0.04166801    0.30879469
       Soft2Brand -0.001045718 0.02349486   -0.04450837
        Pre:Brand -0.157008089 0.03362662   -4.66916072
       Temp:Brand -0.064072675 0.03362662   -1.90541531
     Soft1PreTemp  0.048167488 0.04166801    1.15598236
     Soft2PreTemp -0.000712269 0.02349486   -0.03031595
    Soft1PreBrand -0.062159775 0.04166801   -1.49178638
    Soft2PreBrand -0.030357357 0.02349486   -1.29208509
   Soft1TempBrand  0.012586592 0.04166801    0.30206845
   Soft2TempBrand  0.007774692 0.02349486    0.33091034
   Pre:Temp:Brand  0.050458667 0.03362662    1.50055726
Soft1PreTempBrand  0.010509090 0.04166801    0.25221001
Soft2PreTempBrand -0.019138419 0.02349486   -0.81457903

(Dispersion Parameter for Poisson family taken to be 1 )

    Null Deviance: 118.6269 on 23 degrees of freedom

Residual Deviance: 0 on 0 degrees of freedom
Quite clearly the 4 factor interaction, and all the three factor
interactions can be removed, because of small t-values, which leaves
us with all the 2-factor interactions.
402 >   mymod <- glm(Resp ~ (Soft+Pre+Temp+Brand)^2, family=poisson, data=ries)
402 > summary(mymod)

Call: glm(formula = Resp ~ (Soft + Pre + Temp + Brand)^2, family = poisson, data =
        ries)
Deviance Residuals:
       Min         1Q     Median        3Q      Max
 -1.107065 -0.4930669 0.02855437 0.5093409 1.386992

Coefficients:
                   Value Std. Error      t value
(Intercept)  3.682222962 0.03328281  110.6343930
      Soft1  0.043536098 0.04083575    1.0661272
      Soft2  0.015051992 0.02294280    0.6560661
        Pre  0.036165800 0.03309738    1.0927087
       Temp  0.277223691 0.03296423    8.4098346
      Brand  0.015077502 0.03315577    0.4547474
   Soft1Pre -0.023416451 0.03912050   -0.5985724
   Soft2Pre  0.017893207 0.02258248    0.7923490
  Soft1Temp -0.050438215 0.04091668   -1.2327056
  Soft2Temp -0.049901584 0.02296955   -2.1725101
 Soft1Brand  0.017642716 0.03916083    0.4505195
 Soft2Brand -0.002361722 0.02257536   -0.1046150
   Pre:Temp  0.028578975 0.03322482    0.8601695
  Pre:Brand -0.141752874 0.03193614   -4.4386345
 Temp:Brand -0.064157285 0.03321404   -1.9316312

(Dispersion Parameter for Poisson family taken to be 1 )

    Null Deviance: 118.6269 on 23 degrees of freedom

Residual Deviance: 9.846211 on 9 degrees of freedom
Now things get a little more interesting. It looks like we can get rid of Pre:Temp and Soft:Brand, but what else?
402 > summary(mymod <- update(mymod, . ~ . - Pre:Temp - Soft:Brand))

Call: glm(formula = Resp ~ Soft + Pre + Temp + Brand + Soft:Pre + Soft:Temp + Pre:
        Brand + Temp:Brand, family = poisson, data = ries)
Deviance Residuals:
       Min        1Q      Median        3Q      Max
 -1.207259 -0.395826 -0.02912609 0.4428775 1.363834

Coefficients:
                  Value Std. Error      t value
(Intercept)  3.68213446 0.03329713  110.5841383
      Soft1  0.04409441 0.04083153    1.0799107
      Soft2  0.01492096 0.02294642    0.6502525
        Pre  0.04385639 0.03187799    1.3757577
       Temp  0.27826378 0.03293986    8.4476310
      Brand  0.01662144 0.03311757    0.5018918
   Soft1Pre -0.02717637 0.03867930   -0.7026076
   Soft2Pre  0.01692800 0.02229341    0.7593277
  Soft1Temp -0.05225327 0.04080825   -1.2804584
  Soft2Temp -0.04923468 0.02290183   -2.1498144
  Pre:Brand -0.14381446 0.03185316   -4.5149199
 Temp:Brand -0.06847041 0.03277791   -2.0889194

(Dispersion Parameter for Poisson family taken to be 1 )

    Null Deviance: 118.6269 on 23 degrees of freedom

Residual Deviance: 10.79797 on 12 degrees of freedom
The only likely suspect is Soft:Pre, so remove it.
402 > summary(mymod <- update(mymod, . ~ . - Pre:Soft))

Call: glm(formula = Resp ~ Soft + Pre + Temp + Brand + Soft:Temp + Pre:Brand
    + Temp:Brand, family = poisson, data = ries)
Deviance Residuals:
       Min         1Q      Median        3Q      Max
 -1.433821 -0.3559708 -0.07358303 0.3974668 1.513481

Coefficients:
                  Value Std. Error      t value
(Intercept)  3.68269868 0.03327911  110.6609783
      Soft1  0.04342718 0.04080584    1.0642393
      Soft2  0.01564269 0.02290053    0.6830710
        Pre  0.04343019 0.03185253    1.3634772
       Temp  0.27826441 0.03293940    8.4477687
      Brand  0.01658998 0.03311667    0.5009554
  Soft1Temp -0.05251834 0.04080584   -1.2870299
  Soft2Temp -0.04906982 0.02290053   -2.1427374
  Pre:Brand -0.14376554 0.03185253   -4.5134735
 Temp:Brand -0.06836051 0.03277528   -2.0857337

(Dispersion Parameter for Poisson family taken to be 1 )

    Null Deviance: 118.6269 on 23 degrees of freedom

Residual Deviance: 11.88649 on 14 degrees of freedom
Not much obvious left to do. This is the same model as before.
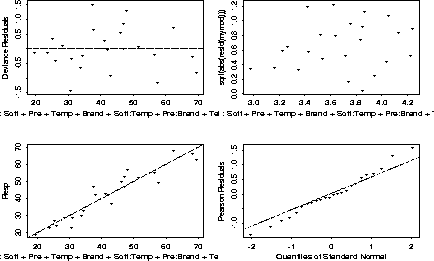
What is this model, and what does it mean? What are the diagnostics?
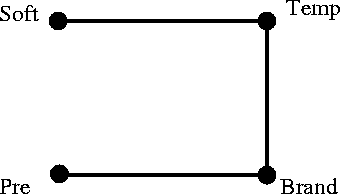
The model is quite easy to read. Soft and Pre and independent of each other, given Temp and Brand. Soft is independent of Brand given Temp, and Pre is independent of Temp given Brand.
Given the time-order of the variables, and what we know about water softness and washing temperature, we might be inclined to suggest possible cause-effect relationships by adding an arrowhead into Temp from Soft, and adding arrowheads from Pre and Temp into Brand.
A plot of the residuals also looks pretty good.
402 > motif()
402 > par(mfrow=c(2,2))
402 > plot(mymod)